


The American Bar Association published its 2022 Profile of the Legal Profession, painting a picture of what the legal industry looks like today and how it’s changing. This year’s report spotlighted diversity on the federal bench, which still has a long way to go, but is becoming more diverse and representative of the overall U.S.
Released on July 28, the 2022 report is the ABA’s third annual compilation of statistics to profile the legal profession by demographics, including gender, race and sexual orientation, as well as salary, job satisfaction and overall well being.
“The 2022 Profile is an indispensable reference for lawyers, journalists, researchers and the public,” ABA President Reginald Turner said in a press release. “This year, the new chapter reveals where judicial diversity is strongest and where it is weakest — and how the latest judicial appointments compare with those of previous administrations.”
Judge Ketanji Brown Jackson was sworn onto the U.S. Supreme Court earlier this year, the first Black woman to sit on the court, and the ABA turned its focus this year to the diversity of the federal bench.
As of July, Jackson is one of only 49 Black women across the country’s 1,409 Article III Federal Judges, representing only 3.4% of the bench. Of the 49 Black women serving on federal courts, 69.4% of them were appointed in the past 10 years under the Obama, Trump and Biden administrations. While the U.S. Supreme Court is currently the most diverse level of the federal judiciary, the rest of the bench is remarkably less diverse.
The majority of the U.S.’s federal judges are white (78.4%) and male (70%), meaning those groups are overrepresented on the bench compared to the general population, which is 59.3% white and around 50% male.
But the bench is slowly becoming more diverse, according to the report. Since 2021, Pres. Joe Biden has appointed the most diverse cohort of federal judges, with 65% of his appointees being people of color and 77% of them being women. The demographics of the 68 judges appointed under the Biden administration are a stark contrast to the appointments by previous presidents. Since the Carter administration in 1977, the majority of judges appointed to the federal bench have been white (between 64% and 94%) and male (between 58% and 92%). The ABA report also found that Democratic presidents were more likely than Republican presidents to make diverse appointments.
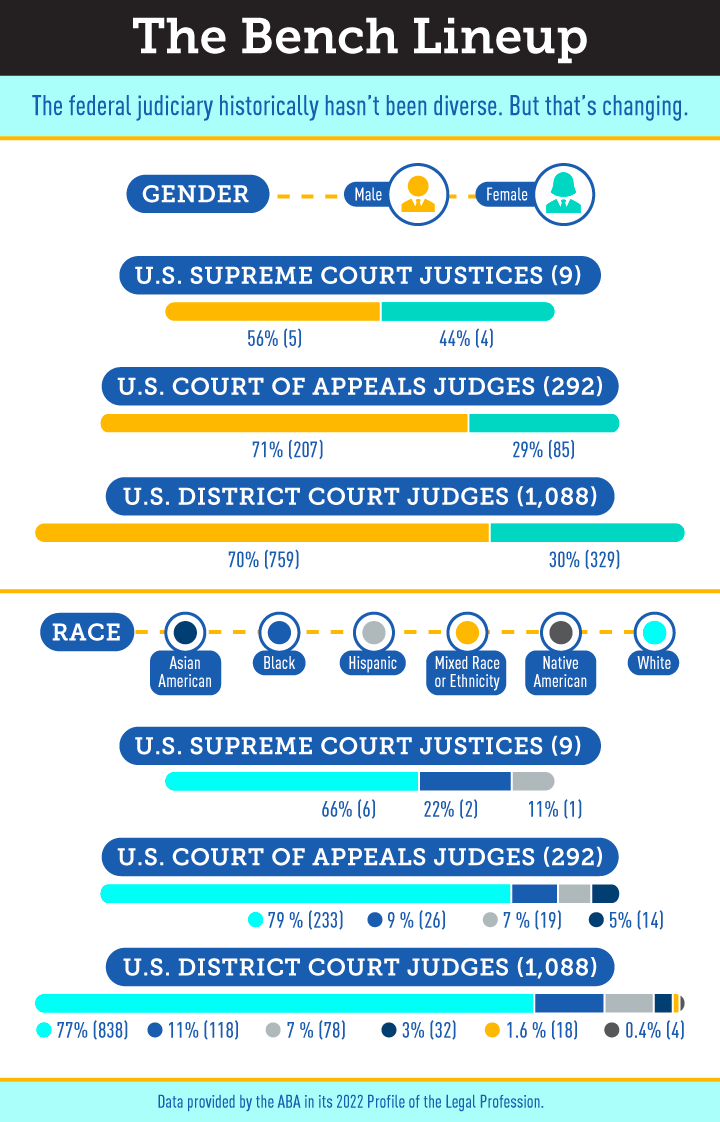
Across the board, people of color are underrepresented on the federal bench, but certain races and ethnicities are particularly marginalized, the report found. Particularly, Hispanic judges made up only 7.7% of U.S. federal judges despite accounting for 18.9% of the U.S. population. According to the report, Colorado has the second-largest percent of Hispanic judges in the country, with three out of 12 judges being Hispanic, or 25%. Colorado was second to New Mexico at 42% and in front of Texas at 23% and California at 16%.
Black and Asian American judges were also underrepresented, making up 11% and 3.8% of the bench respectively, despite accounting for 13.6% and 6.1% of the population.
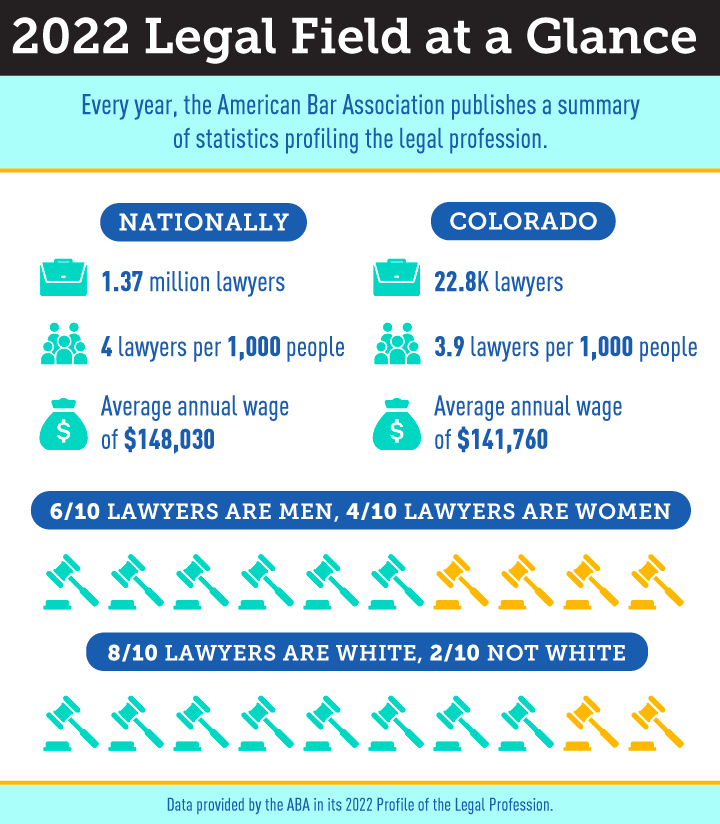
The lack of diversity on the bench likely corresponds to a lack of diversity among U.S. attorneys, according to the report. Compared to lawyer demographics, the federal bench lines up closely with the number of lawyers of color. Only 5.8% of lawyers in the U.S. are Hispanic, 4.5% are Black and 5.5% are Asian American. Women make up 38.3% of attorneys and men make up about 61.5%.
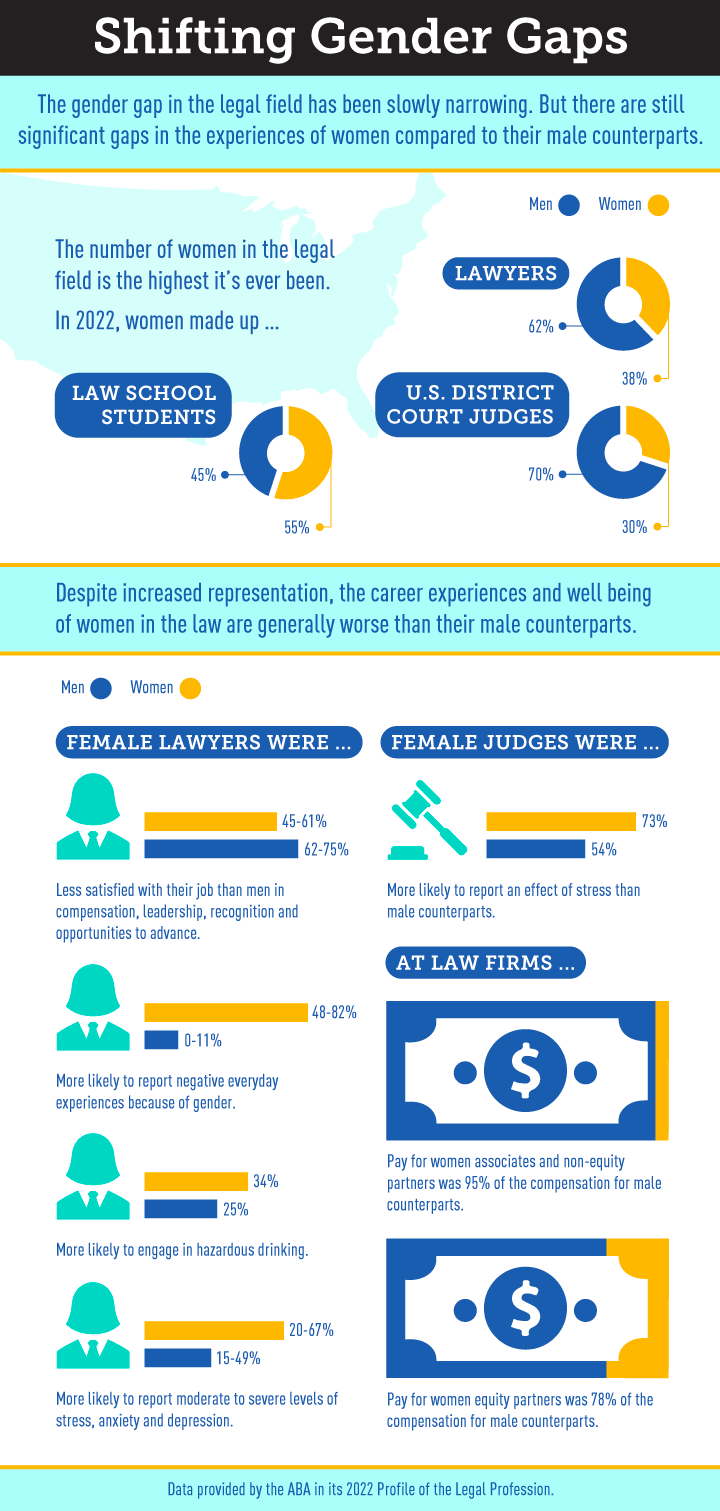
Since the 1970s, the number of women in the law has steadily increased. In 1970, only 3% of the legal profession were women but now 38% of attorneys are women. Law school demographics also reflect more women entering practice. Data from the ABA Section of Legal Education and Admissions to the Bar found in 2021 55.3% of students at ABA accredited law schools were women, 44.4% were men and 0.3%, or 378 students, identified as neither a man nor a woman.
While numbers between men and women in law are closing, other data suggests there are significant differences in their career experiences.
Data collected by the National Association of Women Lawyers in its 2021 survey report found that while nearly half (47%) of all associates at law firms are women, the number of women in leadership roles decreases with senior positions. Women made up about one third (32%) of non-equity partners, 22% of equity partners, only 12% of managing partners, 28% of governance committee members and 27% of practice group leaders. Wage gaps between men and women at the associate and non-equity partner level were much smaller (women making 95% of the salary of their male counterparts) but jumped to higher levels with women equity partners making 78% of the salary of their male counterparts.
A 2019 study by the ABA and ALM also suggests that women in the law have different everyday and career experiences than their male colleagues. Women were more likely to report dissatisfaction with the leadership, opportunities to advance, compensation and recognition for work than men. Women also reported higher numbers of negative everyday experiences due to gender, such as being mistaken for a lower level employee, being perceived as less committed to their work or hearing demeaning stories, jokes and comments.
Women lawyers were also more likely to report hazardous drinking habits, stress, depression and anxiety than men. Data from a May 2021 study on the mental health, attrition and risk factors among licensed attorneys found 34% of women engaged in hazardous drinking (compared to 25% of men), 67% reported moderate to severe stress (49% of men), 23% reported moderate to severe anxiety (15% of men) and 20% reported moderate to severe depression (15% of men).
The report also looked at the job market across the country for lawyers. For the first time in 20 years, attorney salaries fell and didn’t keep pace with inflation rates. Based on statistics from the U.S. Bureau of Labor Statistics, the average annual wage for lawyers in 2021 was $148,030, a slight decrease from $148,910 in 2020. The report also found that salaries varied greatly between regions. The highest compensation markets were concentrated on the coasts, with San Jose, California, San Francisco and Washington D.C. reporting the highest average wage for lawyers. At the other end of the spectrum, attorneys in Puerto Rico and the midwest reported the lowest salaries.
Colorado sat in the upper middle of geographic areas by salary, according to the report. On average, Colorado lawyers make $141,760 annually. Within the state, attorneys in the Denver metro area were paid the most with an average salary of $143,890 followed by Fort Collins lawyers at $132,590 per year, Greeley attorneys at $120,410, Colorado Springs at $106,560, Grand Junction at $105,170 and Pueblo at $97,060. Denver ranked 41 for highest compensation out of a list of more than 280 metropolitan areas examined by the Bureau of Labor Statistics.
Denver was also one of the most in demand legal markets across the country, according to the report. The U.S. Bureau of Labor Statistics calculates a location quotient, or a number to measure demand for services in a particular area, by comparing the ratio of an occupation in a particular area compared to the U.S. as a whole. Using that number, the ABA found the top five metro areas with the highest demand for lawyers were Washington D.C., Tallahassee and Miami in Florida, New York City and Santa Fe, New Mexico. Denver was number eight on the list.