American Bar Association Legal Industry Profile Highlights Legal Aid and the Civil Justice Gap

Most Americans, whether from television, books or their education, know the phrase “you have a right to an attorney. If you cannot afford an attorney, one will be appointed for you.” While this phrase is true for defendants involved in criminal cases, the reality for Americans who find themselves in civil court is much different. 

According to the American Bar Association, the right to counsel in civil matters “exists at present only in very limited circumstances.”


This lack of right to counsel creates problems for many Americans, particularly low-income individuals, who may not be able to afford an attorney. Coupled with the prevailing issue of legal deserts across the country and in Colorado, it leads to a stark rate of individuals who go to court without legal representation. In 2022, 86% of responding parties were without representation in civil cases in Colorado, according to data collected by the Colorado Judicial Branch. 

Infographic titled Pro Se Rates in Colorado. Subtitle Domestic Relations. Two circles showing the percentage of pro se rates for filing parties and responding parties. Both circles are mostly full, with 74% pro se rate for filing parties and a 73% pro se rate for responding parties. Subtitle District Civil. Two circles showing the percentage of pro se rates for filing and responding parties. The filing party circle is mostly empty with a 14% pro se rate. The responding party circle is around half full with a 52% pro se rate. Subtitle County Civil. Two circles showing the pro se rates for filing and responding parties. The filing party circle is mostly empty with a 20% pro se rate. The responding party circle is nearly full with a 97% pro se rate. Subtitle Overall. Two circles showing the overall pro se rate for filing parties and responding parties. The filing party circle is around a third full with a 32% pro se rate. The responding party circle is mostly full with a 86% pro se rate. Data courtesy of the Colorado Judicial Branch, Fiscal Year 2022.
Colorado Civil Court Pro Se Rates: the percentage of cases without attorney representation in civil courts in Colorado, excluding Denver County. Data provided by the Colorado Judicial Branch / Infographic Design by Chalyn Tallman for Law Week Colorado.

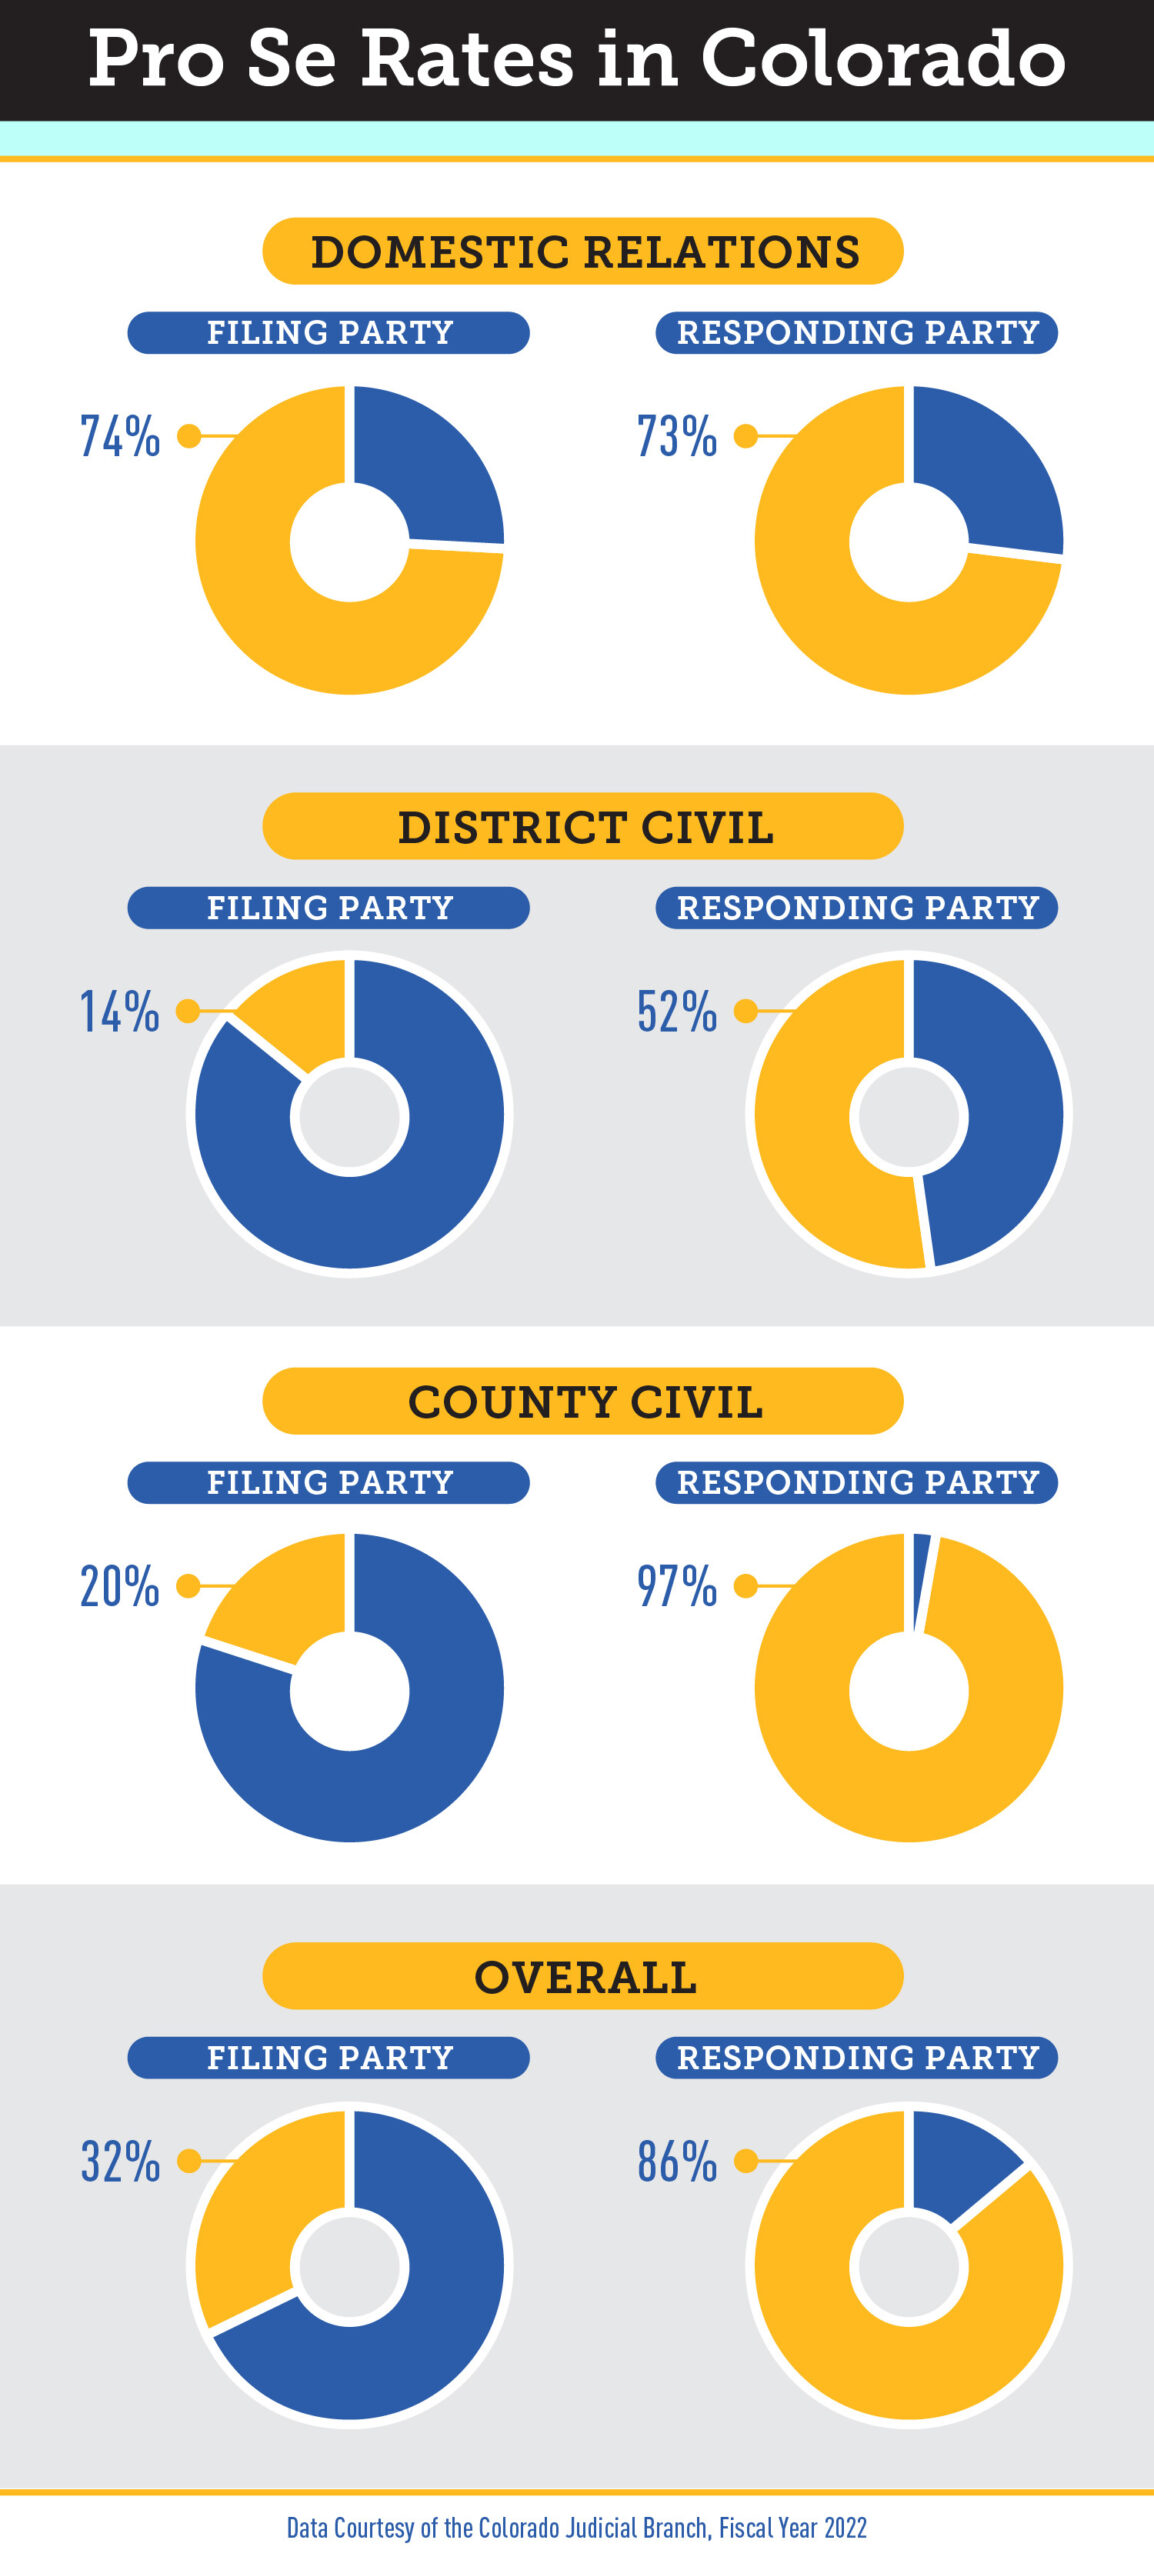
The pro se rates in Colorado were notably better on the filing party side, with a pro se average of 32%. Notably, the pro-se rate for domestic relations cases was close on both sides of the courtroom, with a pro-se rate of 74% for filing parties and 73% for responding parties. The most extreme divide in representation was in county civil cases, with a pro se rate of 20% for filing parties and 97% for respondent parties. 

There are groups across the country working to fill this gap, and one of the most notable groups are legal aid organizations, which were a focus of the American Bar Association’s 2023 Profile of the Legal Profession.

A Crucial Resource with Uneven Distribution 

A lack of representation in civil cases is not a problem unique to Colorado. According to the 2022 Justice Gap report from the Legal Services Corporation, 92% of low-income Americans don’t receive adequate help for civil legal problems, and many don’t receive any help at all. 

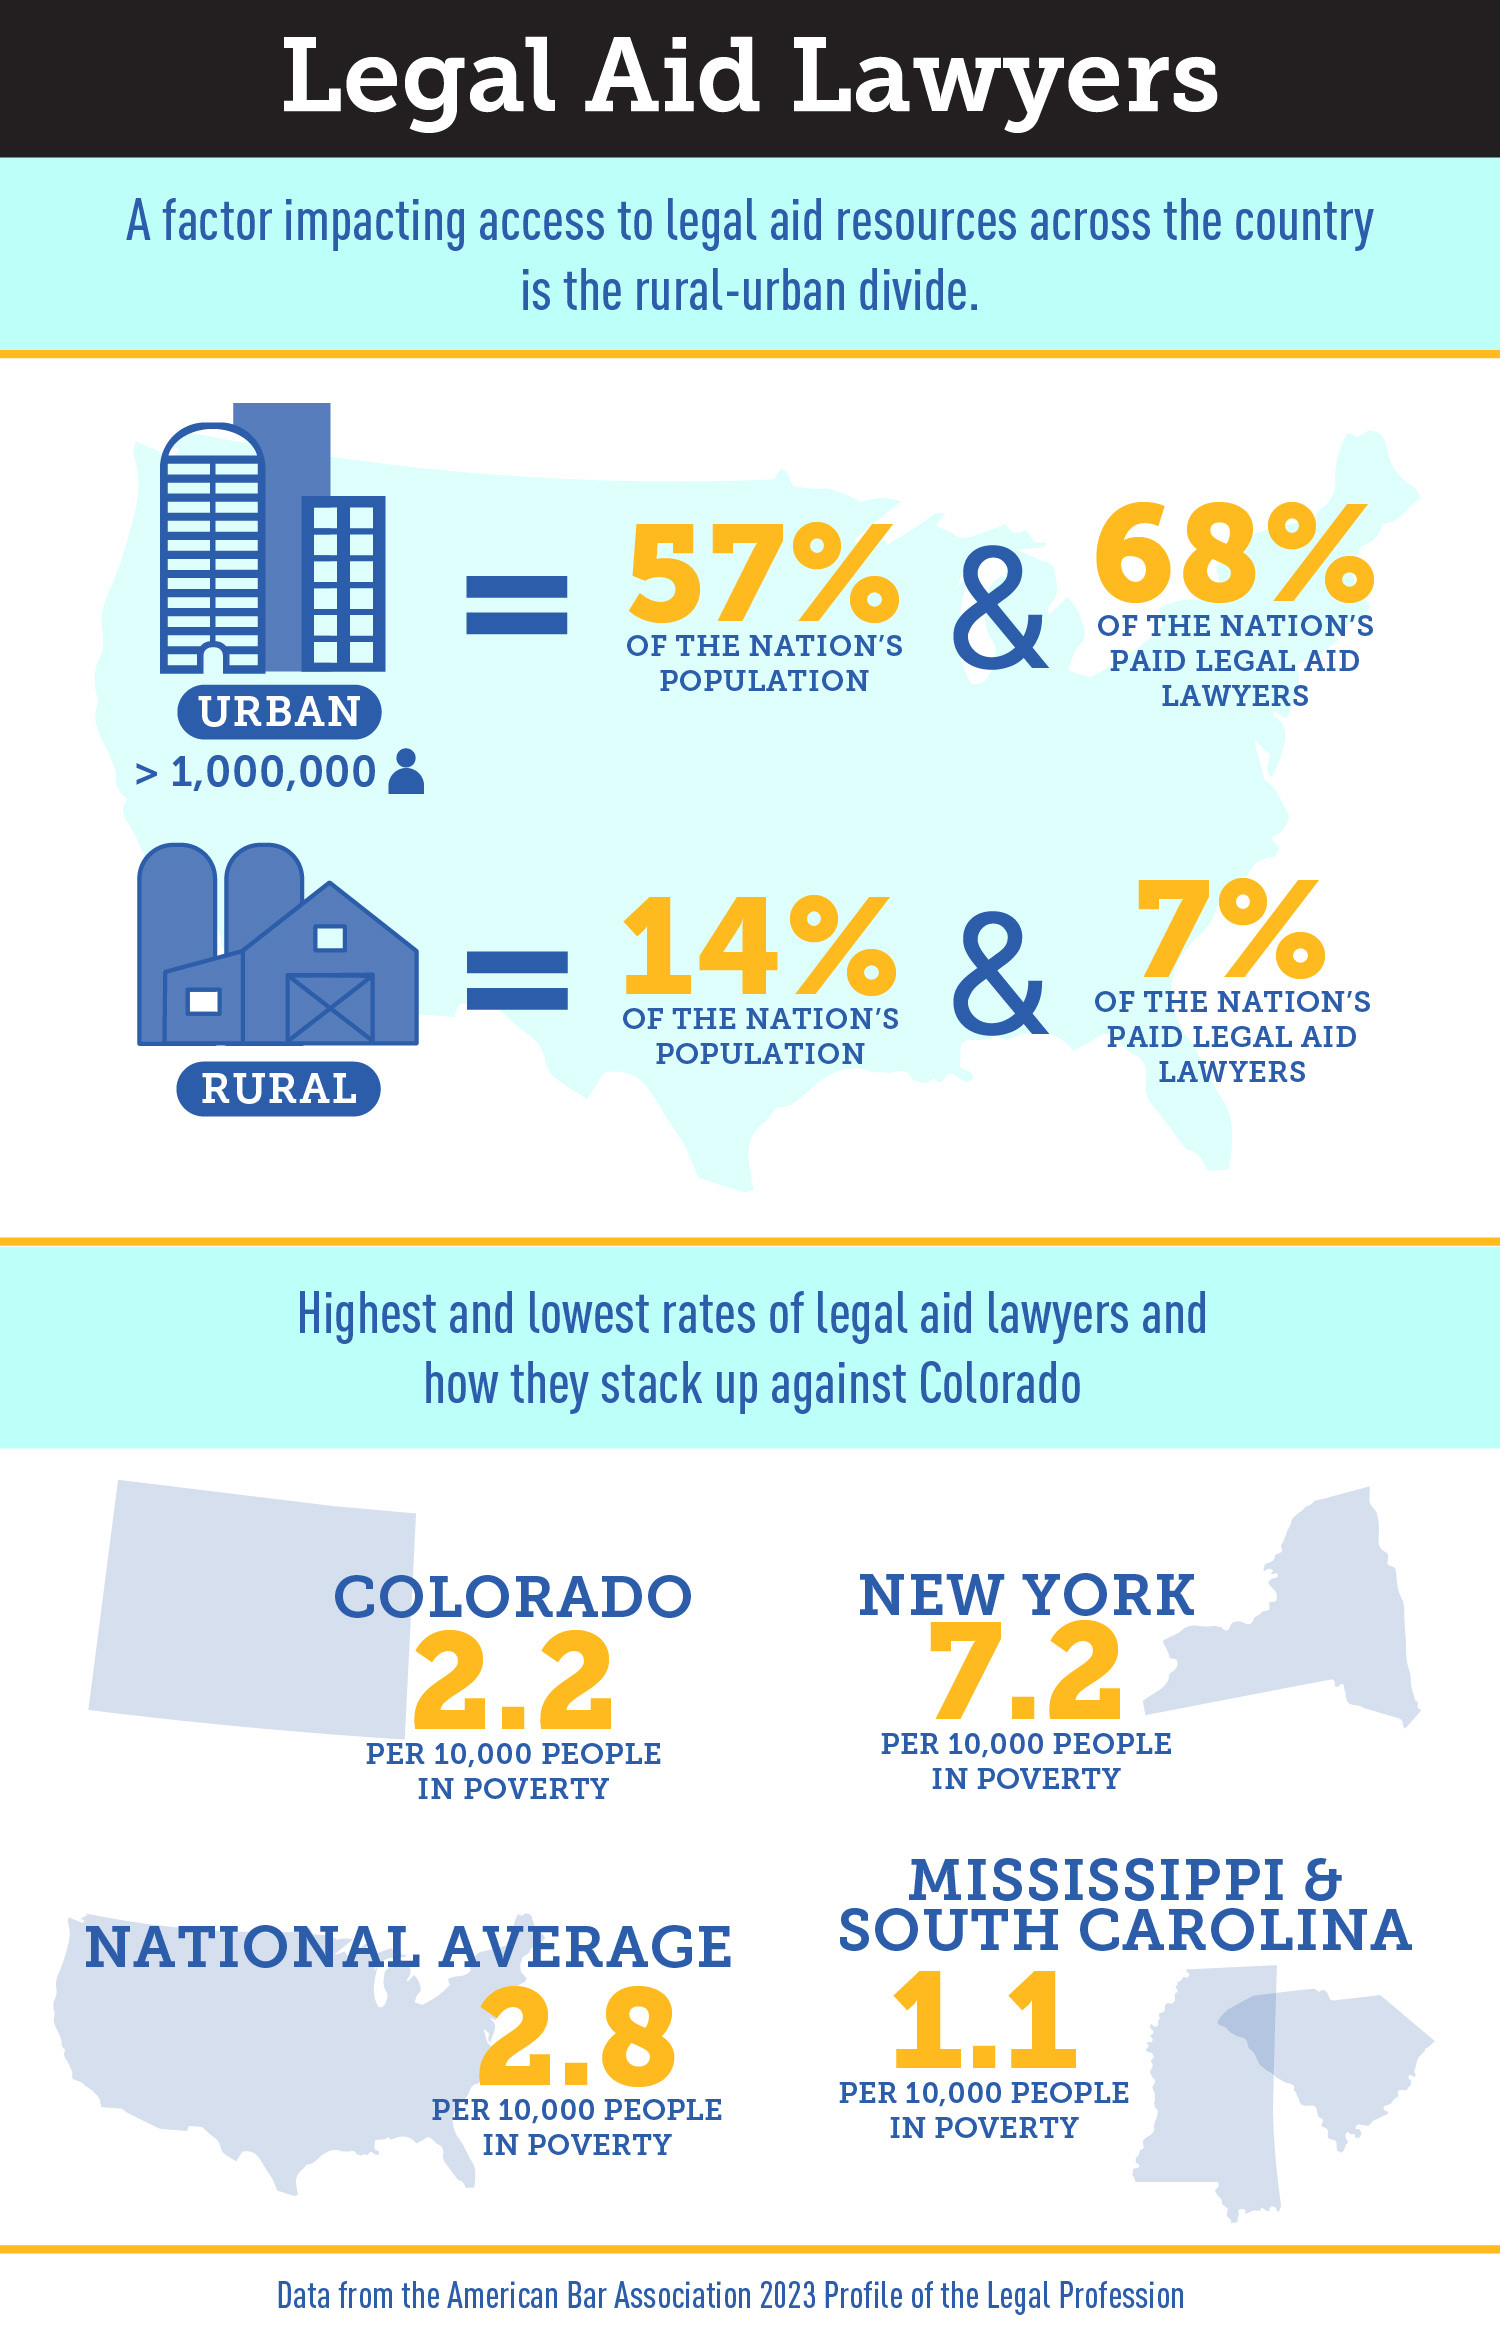
However, an individual’s location can play a significant part in their ability to find legal aid. The luckiest residents are those who live in New York, particularly New York City. According to the ABA survey, 1 out of 6 legal aid lawyers live in the state, with more than 1,000 living in New York City alone. 

These numbers break down to 7.2 legal aid lawyers per 10,000 people in poverty, the highest in the country, according to the ABA report. On the flip side, Mississippi and South Carolina have a rate of 1.1 legal aid lawyers per 10,000 people in poverty. Colorado fairs a little better in the survey, with a 2.2 average per 10,000. However, Colorado sits below the national average of 2.8. 

Another factor impacting access to legal aid resources across the country is the rural-urban divide. Metropolitan areas with more than a million residents, which contain 188 million people, or 57% of the nation’s population, contain 68% of the country’s paid legal aid lawyers. Rural areas, on the other hand, make up 14% of the population, but only 7% of paid legal aid lawyers live in them. 

Infographic titled Legal Aid Lawyers, subtitled A factor impacting access to legal aid resources across the country is the rural-urban divide. Subtitle urban under a graphic of skyscrapers with urban defined as a metropolitan area of more than one million people. The percentage of the nation's population in urban areas is 57% and contains 68% of the nations paid legal aid lawyers. Subtitle rural under a picture of a barn. The percentage of the nation's population in rural areas is 14% and contains 7% of the nation's paid legal aid lawyers. Subtitle Highest and lowest rates of legal aid lawyers and how they stack up against Colorado. Picture of Colorado state outline with 2.2 legal aid lawyers per 10,000 people in poverty. Picture of New York state outline with 7.2 legal aid lawyers per 10,000 people in poverty. Picture of the United States country outline with 2.8 legal aid lawyers per 10,000 people in poverty. Pictures of the Mississippi and South Carolina state outlines with 1.1 legal aid lawyers per 10,000 people in poverty.
Legal Aid Lawyers distribution: A snippet of where legal aid lawyers live in the United States. Data courtesy of the American Bar Association 2023 Profile of the Legal Profession / Infographic design by Chalyn Tallman for Law Week Colorado.

While there is currently a nationwide dearth of legal aid lawyers, the ABA report did note a bright spot. The number of legal aid lawyers in LSC-funded organizations has grown over the past nine years by 52%, from 4,306 to 6,542. These numbers are in addition to an estimated 4,300 attorneys in organizations not funded by LSC. Even with this growth, the report noted “there are still not nearly enough legal aid lawyers to help all the low-income families and individuals with civil legal problems.”

Diversity Continues to Steadily Grow in the Legal Profession  

Last year’s ABA report spotlighted diversity on the federal bench, and this year’s showed another steady increase in diversity across the legal profession. 

The percentage of female lawyers has risen 5% over the last decade, from 34% in 2013 up to 39% in 2023, according to the report. Given current demographic trends at law schools, the percentage will likely continue to rise. Women made up 55.7% of students pursuing a juris doctor degree at ABA-accredited law schools in 2022, continuing a six-year trend of women outnumbering men in law schools. 

The ABA report also noted that the percentage of lawyers of color came close to doubling in the last decade, increasing from 11% to 21%. White lawyers are still over-represented in comparison to the US population at 78%, in contrast to making up roughly 59% of the population, but the gap is closing. 

Infographic titled Diversity in the Legal Industry, subtitled Every year, the American Bar Association publishes a summary of statistics profiling the legal profession. 2 stacked bars with an arrow through them going upwards. The stacked bar on the left represents the percentage of female lawyers in 2013 at 34% and the stacked bar on the right represents the percentage of female lawyers in 2023 at 39%. Image of an outline of a woman, subtitled the percentage of female lawyers has risen by 5%. Subtitle Students Pursuing a Juris Doctor Degree in 2022. A stacked bar with a graphic of a woman on the left and man on the right. The left side of the bar shows 55.7% for women pursuing a JD degree and the right side of the bar shows 44.3% for men pursing a JD degree in 2022. Captioned this continues a six year trend of men outnumbering women in law schools. Subtitle Lawyers of Colors. Caption (Almost doubling the numbers). Two bars with an upwards facing arrow running through them. The bar on the left shows 11% in 2013 and the bar on the right shows 21% in 2023, reflecting the percentage of lawyers of color in the United States. Captioned White lawyers are still over-represented in comparison to the US population at 78%, in comparison to making up roughly 59% of the population, but the gap is closing. Subtitle Asian Americans. Small bar with the caption 6% of lawyers are Asian American. Small bar with the caption 6.3% of the US is Asian American. Subtitle Hispanic. Two small bars with an upwards facing arrow running through them. The bar on the left shows 3.7% in 2013 and the bar on the right shows 6% in 2023, representing the growth in Hispanic lawyers. Two bars, one smaller and one larger. The small bar is captioned 6% of Lawyers are Hispanic. The larger bar is captioned 19.1% of US is Hispanic. Subtitle Black. Two bars with an upwards facing arrow running through them. The bar on the left shows 4.8% in 2013 and 5% in 2023. Two bars, one small and one larger. The small bar is captioned 5% of lawyers are Black. The larger bar is captioned 13.6% of US is Black. Subtitle Learning the Ropes. Captioned In addition to the growing diversity among attorneys is a continued growth of diversity in law schools. According to the ABA report, in 2022 one-third of law school students were people of color, an increase of 6% over the past decade. Stacked bar split between the colors yellow and blue. A third of the bar is yellow at 33.3% representing people of color in law school. Two-thirds of the bar is blue at 66.6% representing white people in law school. Data provided by the ABA in the 2023 profile of the legal profession.
Diversity in the legal profession: A look at how diversity is steadily increasing across licensed attorneys and law schools. Data courtesy of the American Bar Association 2023 Profile of the Legal Profession / Infographic Design by Chalyn Tallman for Law Week Colorado

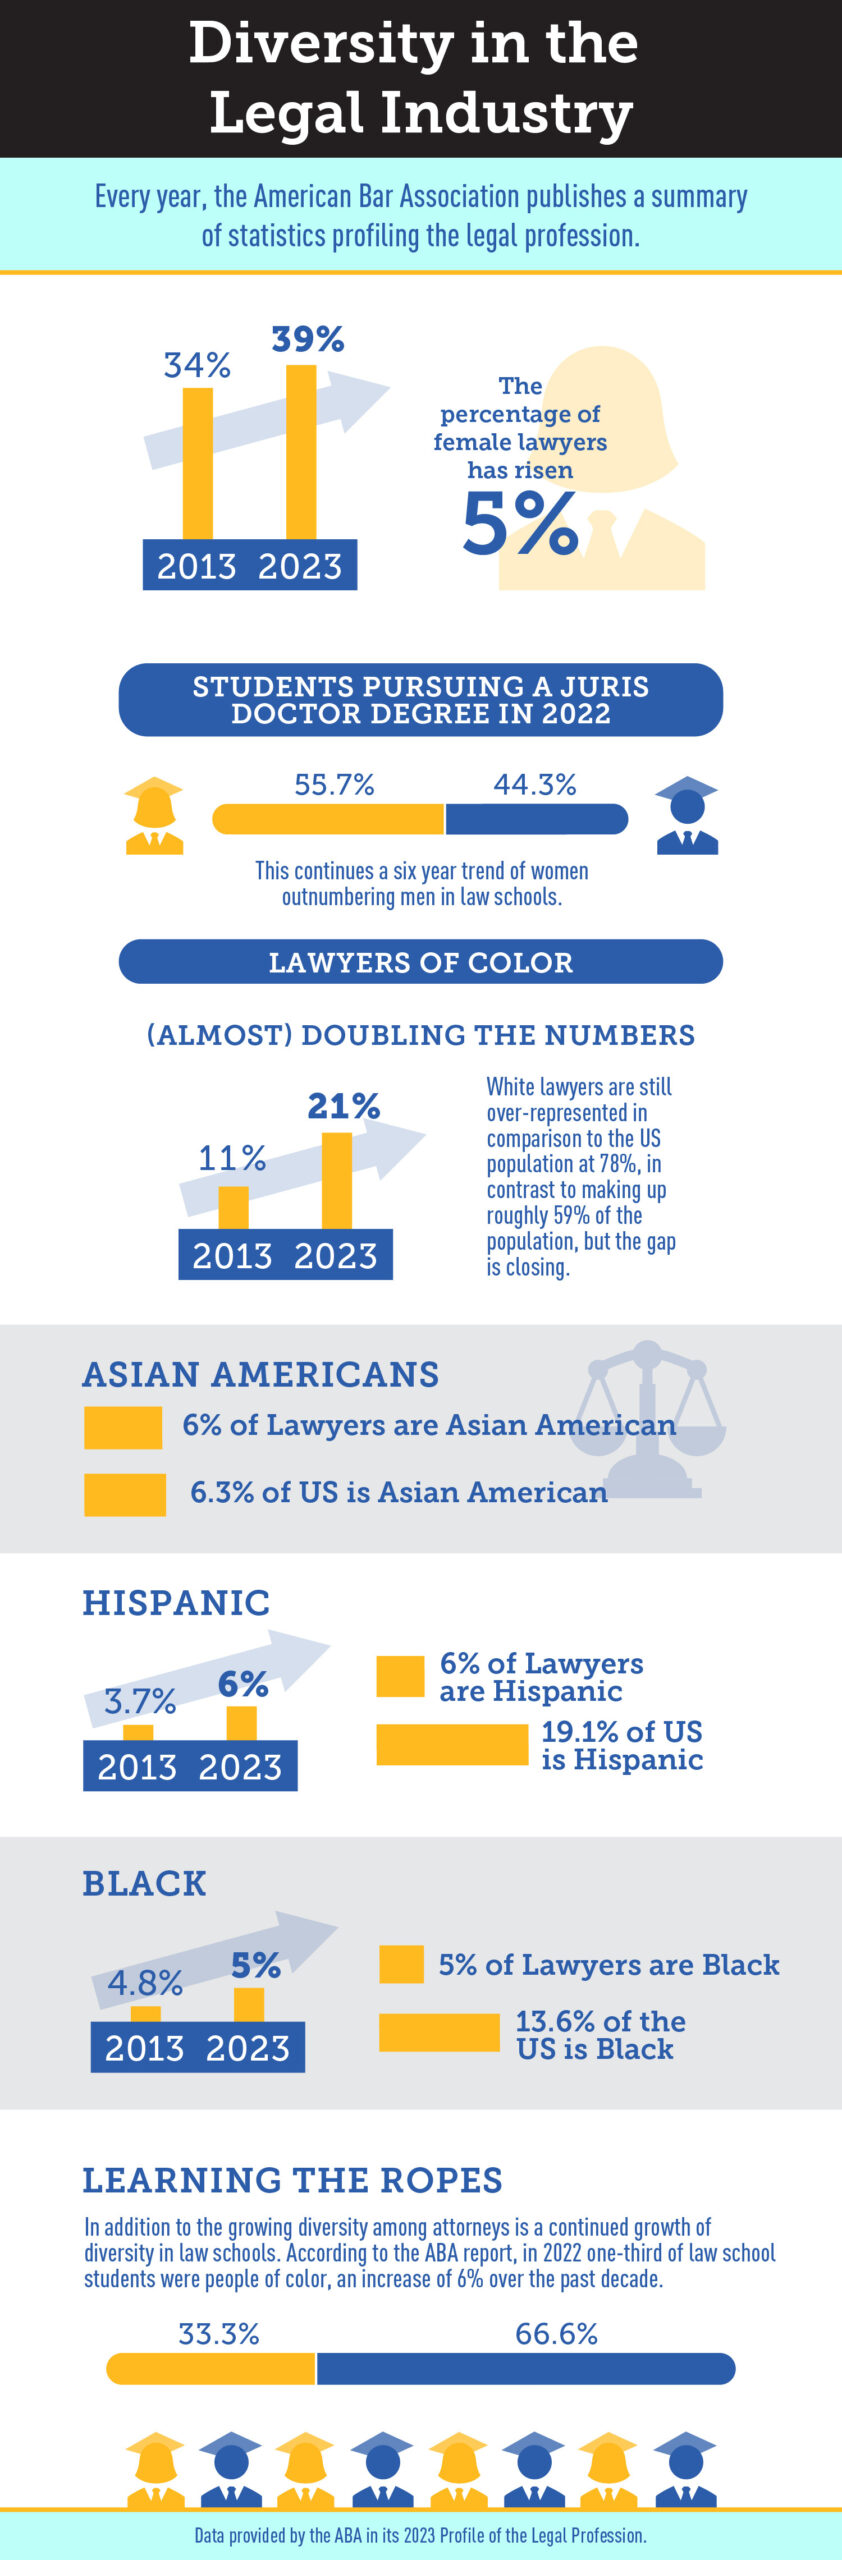
The most notable increases, in significant part due to California beginning to report the race and ethnicity of its lawyers, were in the representation of Asian-American and Hispanic lawyers. The percentage of Asian-American lawyers comes close to their share of the US population, at 6% compared to 6.3%, respectively. 

The number of Hispanic lawyers also grew in the past decade, from 3.7% to 6%, but still remain underrepresented in relation to their share of the US population of 19.1%. The percentage of Black lawyers increased slightly over the past decade, moving from 4.8% to 5%. However, that number still remains significantly lower than their 13.6% share of the US population. 

In addition to the growing diversity among attorneys is a continued growth of diversity in law schools. According to the ABA report, in 2022 one-third of law school students were people of color, an increase of 6% over the past decade. 

If the trend lines remain the same, diversity in the legal community will continue to grow. 

Previous articleCourt Opinion: Presiding Disciplinary Judge Opinion for Dec. 4
Next articleAG Phil Weiser Sues National Collegiate Athletic Association

LEAVE A REPLY

Please enter your comment!
Please enter your name here